
Fiber Art 101: Basketry
Featuring sculpture artist Natalie Miebach
Antarctic Explorer – Darkness to Lightness
Reed, wood, plastic, data, 4,5’ x 3’ x 2’ , 2007
A portable data device for the Antarctic Explorer, this piece explores the transition from complete darkness in June to 24 hour sunlight in October. Data translated include weather patterns, temperature variations, barometric pressure, wind data, azimuth of the sun, sunrise in relation to cardinal directions, tides, moon phases, moonrise and sunrise. Using a base of 24 hour, every weave represents one hour.

Arctic Sun - Solar Exploration Device for the Arctic
Reed, wood, plastic, steel, data, 6’x6’x4’, 2006
Using a base of 48 hours, this piece converts various layers of data (July 06 – June 07) related to the gravitational influence of both Sun and Moon on the Arctic environment. Additional data translated include tide readings, moon phases, solar path in relation to horizon and the distance between Sun and Earth.

Boston Tides
Reed, wood, data, 6’x 6’ x2’, 2006
Using a base of 24 hours, this piece converts various layers of data (Jan-Dec 2005) related to the gravitational influence of both Sun and Moon on tides recorded at Boston Harbor. The inner structure converts sunrise/set and moonrise/set data into the woven structure, with every weave representing one hour. Additional data translated include tide readings, moon phases and the solar path in relation to the horizon.
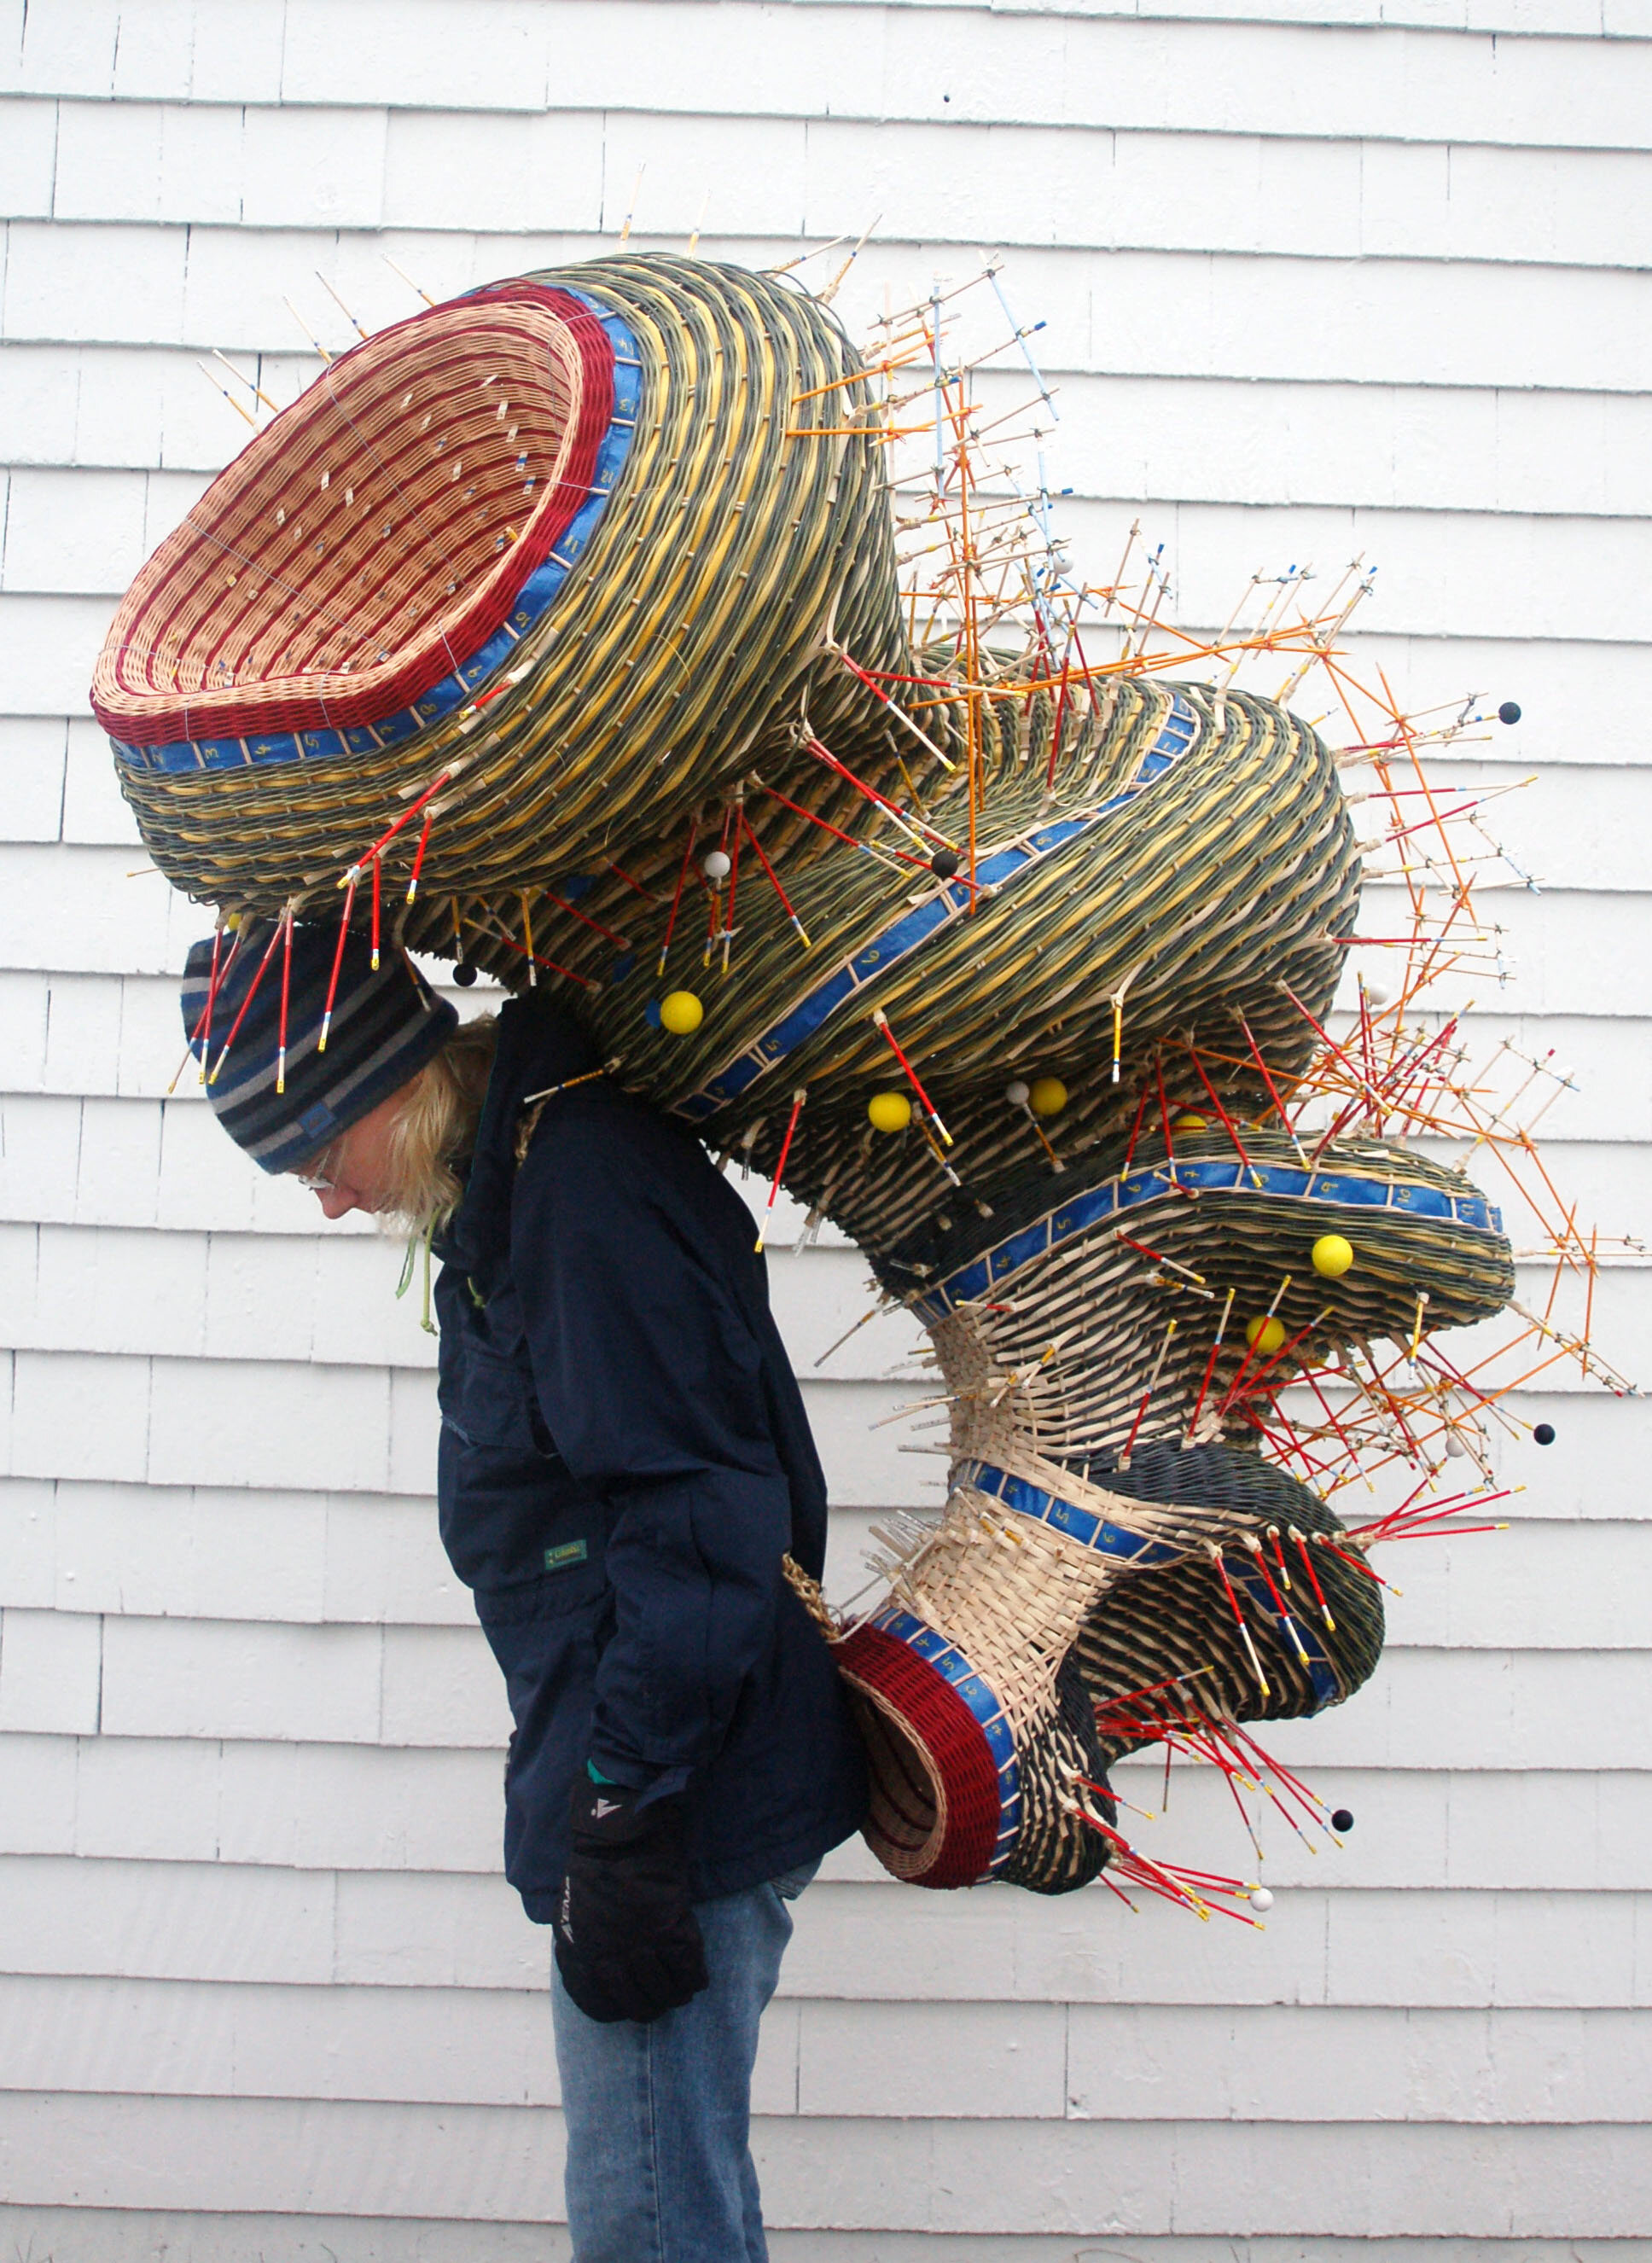
Basketry is the ancient art of creating baskets by interweaving plant materials, predating ceramic containers. The sheer variety of available plants flexible enough to create vessels has allowed for baskets to take on many different forms, including coiled, plaited, and twined. Basket-making is at least 10,000 years old, and evidence of basketry has been found all around the world.
Contemporary basketry encompasses a broad array of sculptural forms, wall hangings, and some two-dimensional forms such as mats; it includes traditional materials such as reed, pine needles, and wicker, as well as more unusual materials such as wire, horsehair, paper and seaweed.
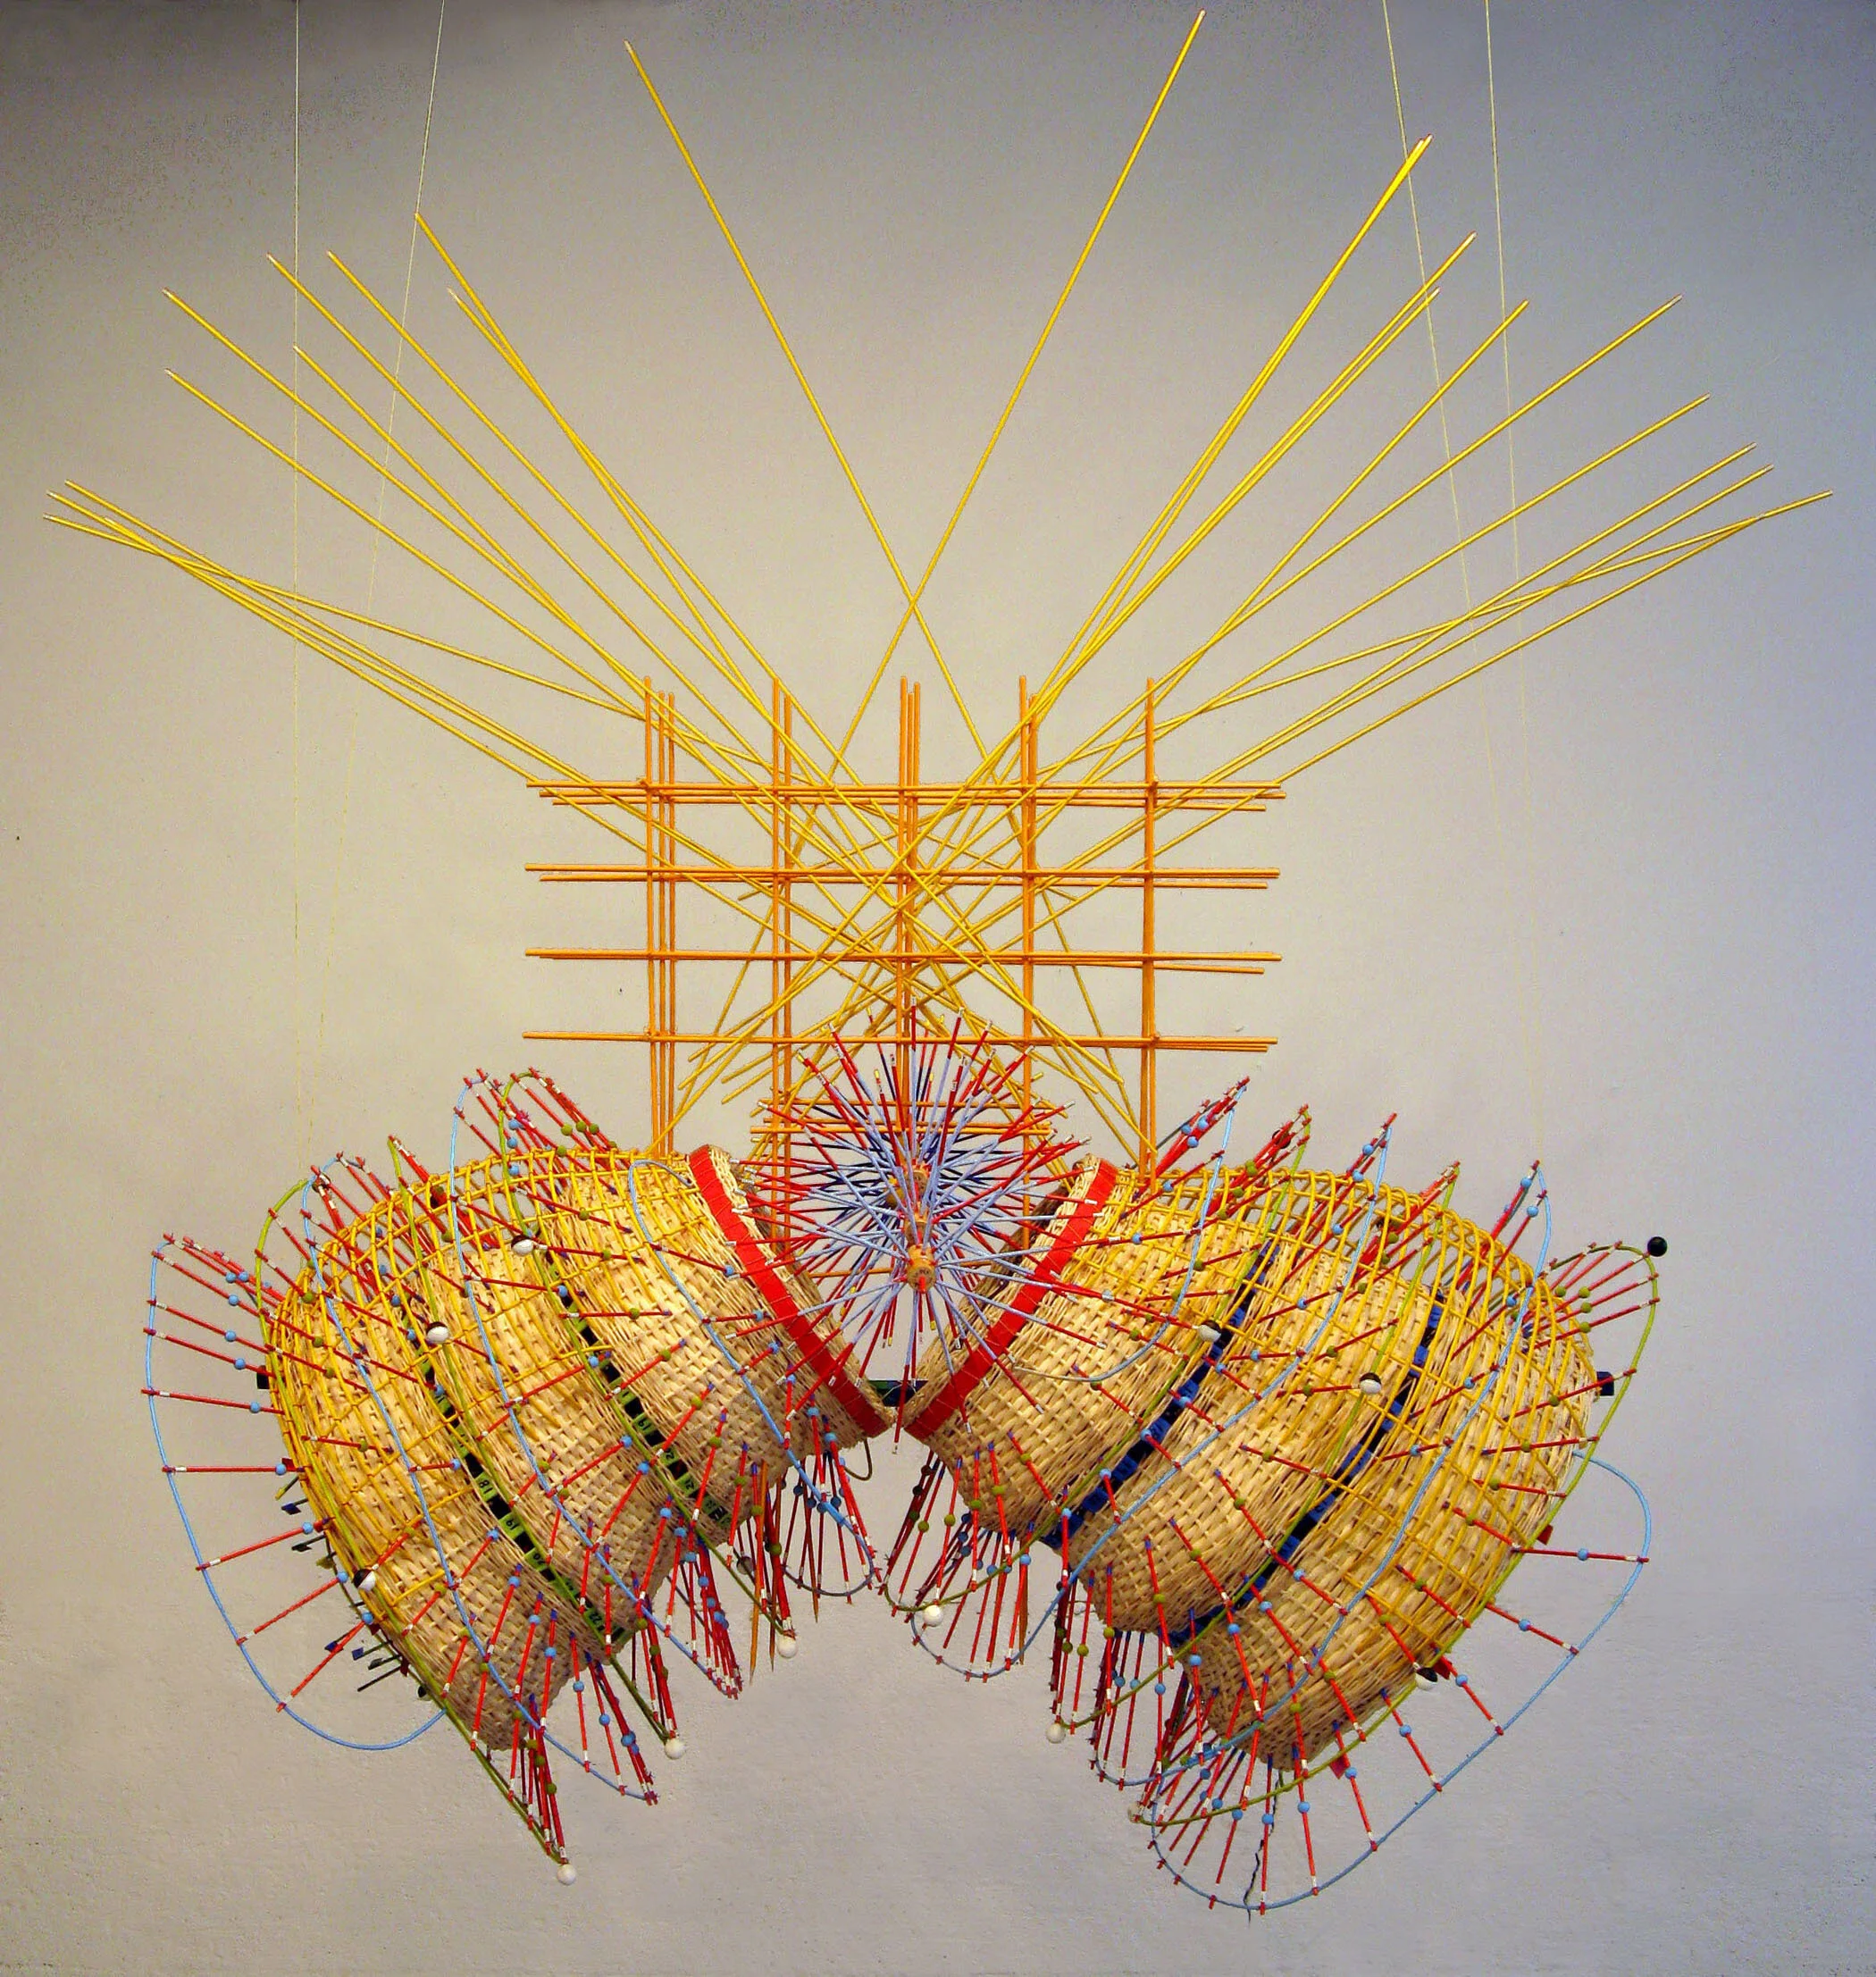
Natalie Miebach (@miebachsculpture) uses weaving and basketry to translate weather data into sculpture and musical scores. Her work is inventive and an incredible way to use art to visualize data collection from extreme weather events. How incredible are the details in her artworks?
Artworks featured, "Antarctic Tidal Rhythms", "Boston Tides", "Arctic Sun - Solar Exploration Device for the Arctic", "Antarctic Explorer – Darkness to Lightness", "Warm Winter: Dec 2006 – Jan 2007", "Solar Beginnings of Everything that Changes", "Jordan Basin Buoy - Searching for Right Whales in the Gulf of Maine", "Eastern Maine Shelf Buoy - Searching for Right Whales in the Gulf of Maine" All credit to the artist.

Antarctic Tidal Rhythms
Reed, wood, styrofoam, data, 8’ x 6’ x 3’, 2006
Using a base of 24 hours, this piece converts various layers of data (Jan-Dec 2005) related to the gravitational influence of both Sun and Moon on the Antarctic environment. The inner structure converts sunrise/set and moonrise/set data into the woven structure, with every weave representing one hour. Additional data translated include tide readings moon phases, solar noon readings and the molecular structure of ice.
Solar Beginnings of Everything that Changes
Reed, wood, data56”x66”x27”, 2008Without the sun, there would be no weather. Without weather and its daily changes, there would be no life on Earth the way we know it. Somehow within this daily search for equilibrium in the atmosphere and in the water, every life form find its own niche to survive. This piece looks at ecological changes as observed at Herring Cove Beach (Cape Cod), all of which find their ultimate origin in the sun. Data translated includes: air & water temperature, barometric pressure, tides, solar azimuth and moon phases. The time frame is October 07 – March 08.

Jordan Basin Buoy - Searching for Right Whales in the Gulf of Maine
Reed, data, wood, plastic, plaster2’x2’x5’, 2008
In late summer, Right Whales are often found in large numbers at the mouth of the Bay of Fundy. In this piece, I am translating various ocean and air data to help me understand what ecological conditions exists to entice these whales to congregate in such large numbers in this particular area. Each sculpture translates ocean and air data specific to the topographical location of the buoy in the Gulf of Maine. All buoys for this project are of the Gulf of Maine Observation System (GOMOOS). Local buoy data is also compared to larger, historical climate/weather data sets.


Warm Winter: Dec 2006 – Jan 2007 (From the series: Recording & Translating Climate Change on Cape Cod
Reed, wood, data, 6’x 5’x6’, 2007
Using a base of 24 hours, this piece converts locally collected data (at Herring Cove) , with data from regional buoys (source: Gulf of Maine Observation System) and historical data (source: www.wunderground.com, NOAA and U.S. Naval Observatory). Data converted includes temperature (air, water, soil), wind speed and direction, tides and moon phases.

Eastern Maine Shelf Buoy - Searching for Right Whales in the Gulf of Maine
Reed, data, wood, plastic, plaster2’x2’x4’, 2008
In late summer, Right Whales are often found in large numbers at the mouth of the Bay of Fundy. In this piece, I am translating various ocean and air data to help me understand what ecological conditions exists to entice these whales to congregate in such large numbers in this particular area. Each sculpture translates ocean and air data specific to the topographical location of the buoy in the Gulf of Maine. All buoys for this project are of the Gulf of Maine Observation System (GOMOOS). Local buoy data is also compared to larger, historical climate/weather data sets.